The Impact of COVID-19 on Survey Behaviors: What We’ve Learned So Far
August 9, 2022
By Angela Hall

When the pandemic hit, nonprofits across the country developed new approaches to adapt to the changed environment. Volunteers in Medicine (VIM) in Luzerne County, Pennsylvania, was one of those organizations. VIM provides free medical, dental, and behavioral health services to low-income working families, many of whom are Spanish-speaking.
In the spring of 2020, VIM had developed their Listen4Good (L4G) survey, which was supposed to be administered in person during patient visits. With their sudden shift to a telehealth model due to the pandemic, the VIM team revamped their survey to focus on COVID-19 and the needs of their clients. They also decided to administer their survey over the phone.
Over the course of the following 18 months, VIM periodically adjusted their surveying methods—pursuing phone surveys as well as mail surveys—while continually fine-tuning language in English and Spanish to seek input more effectively.
VIM’s experience provides an illustrative example of how organizations had to adjust their survey methods during the pandemic to obtain responses from communities who are often without voice. It also raises sector-level questions around how the pandemic has affected general surveying strategies and clients’ willingness to participate, both of which are vital to making effective changes informed by client feedback.
As L4G’s data analyst, I wondered:
- Would the pandemic cause lasting shifts in organizations’ surveying methods?
- Would clients still take the time to complete requests for surveys? How would response rates be impacted during the pandemic?
- And lastly, would feedback obtained via surveys during the pandemic still be useful?
The first two questions are important in surveying because they determine the extent to which one can obtain a large number of responses, as well as responses that are representative of the client population served. Big, representative samples let us generalize our survey results to a larger population of interest, and subsequently help one feel confident that acting on those results will benefit most clients, especially those least heard.
While getting sufficient survey responses and high response rates is important, achieving them is a challenge even under normal circumstances. This is particularly true for organizations that participate in L4G, where power imbalances are strong between providers and clients, where technology and digital access is so variable, and where authentic trust is key to getting surveys to be taken.
Furthermore, we know that in-person (onsite) administration and paper surveys have historically worked well for L4G organizations and reap better data collection outcomes. In fact, in-person paper surveys were the most common way L4G organizations surveyed clients prior to 2020.
The restrictions introduced due to COVID-19 forced organizations to provide remote service delivery and limit in-person contact. These drastic changes meant that asking for feedback felt ever more important, but the methods for gathering feedback also had to drastically change.
Changes in Surveying Approaches
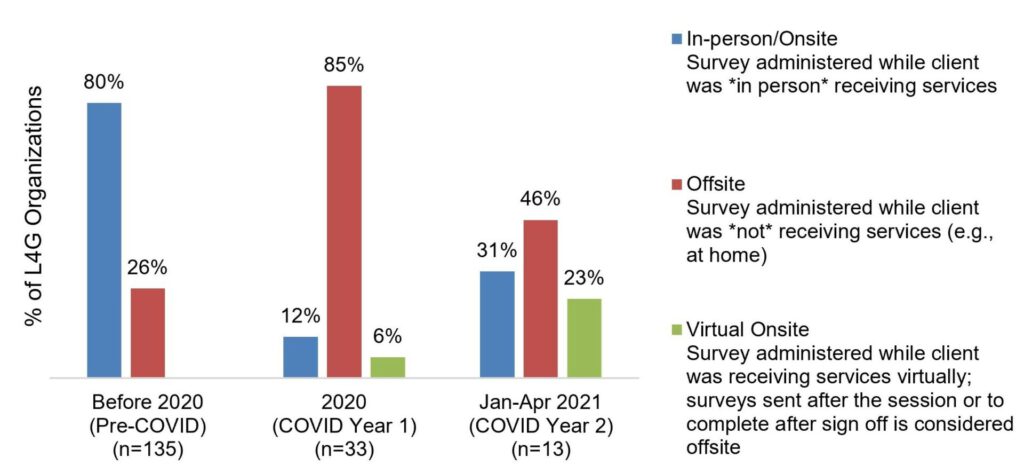
The bar graph below shows how L4G organizations surveyed their clients during three timepoints: before 2020 (pre-COVID), 2020 (COVID Year 1), and Jan-April 2021 (COVID Year 2).
Types of surveying methods used by L4G organizations before and during COVID

(Data does not total 100% because organizations could use more than one method)
Not surprisingly, the majority (85%) of organizations that administered feedback surveys in 2020 surveyed clients via offsite methods, which is different to pre-COVID methods. Additionally, prior to the pandemic, the top two data collection methods were paper and tablet surveys (in-person/onsite methods); in 2020, the top two were email and text/SMS surveys (offsite methods).
A couple things jump out to me from this data:
- In COVID Year 2, we preliminarily see organizations go back to in-person methods, but offsite methods are still being used. This suggests that organizations may have found new capacities that continue to serve them well today. They may also still be juggling dual service delivery.
- Some organizations used virtual onsite methods in which they administer feedback surveys via a link at the end of a virtual session while the clients are still connected online. However, anecdotes from organizations suggest this method generates mixed success and depends on an organization’s survey eligibility criteria, programs/services, and client demographics.
Also, we know that offsite surveying methods typically receive lower response rates. With so many organizations forced to go with offsite surveying—and new methods such as virtual onsite being implemented—this made me wonder how response rates compare to the rates achieved prior to 2020.
My glass-half-empty brain expected low response rates across the board and maybe even moving forward. But (spoiler alert!) the data actually wasn’t so dreary.
Changes in Survey Response Rates
The table below shows the median response rate of organizations’ feedback surveys during the three timepoints noted previously.
Median response rate of program surveys administered by L4G organizations before and during COVID
| Timepoint(n=total unique organizations) | Median Response Rate of Program Surveys | Total Program Surveys |
| Before 2020 (Pre-COVID)(n=187) | 57% | 324 |
| 2020 (COVID Year 1)(n=34) | 43% | 41 |
| Jan-Apr 2021 (COVID Year 2)(n=27) | 52% | 32 |
Comparing 2020 to pre-COVID, we see a noticeable drop in survey response rates. But beginning January 2021, the initial “shock” appears to have subsided. Although data is limited, we see preliminary evidence that organizations are bouncing back to similar response rates to pre-pandemic times.
This leads me to two observations regarding response rates:
- Response rates during COVID were surprisingly robust for surveying that was mostly done offsite (especially in a new, volatile environment). Prior to COVID, we found that offsite surveying typically produced a median response rate of 37%. During COVID, organizations—employing mostly off-site surveying—achieved a 43% response rate, which is largely on par with pre-pandemic data.
- This preliminary data indicates that the pandemic may have only created a temporary shock to response rates, as response rates seem to be improving again.
While the data doesn’t tell us why these two things happened, anecdotal stories from coaches and other sources provide several explanations. During this time, organizations:
- improved their outreach and communications due to in-person restrictions, and these improved methods may have helped in survey administration;
- fine-tuned creative and resourceful ways to administer surveys and to utilize existing infrastructure;
- refocused surveying efforts on a subset of clients or a different program due to competing priorities in time, capacity, and programming;
- redesigned surveys so questions were much more relevant to the COVID context that may have garnered increased participant attention; and/or
- began returning to some in-person approaches that contributed to improved response rates.
With VIM, several of the above ring true. Along with redesigning their survey to be COVID relevant and shorter, VIM used their existing Electronic Medical Record system to capture survey responses that made aggregating and reporting data by demographics quicker. While they conducted most surveys by phone, they were able to reach a key population with mailed surveys to patients who requested it. Mailed surveys worked particularly well for patients who self-identified as Spanish speakers and who were more comfortable completing the survey on their own time. Getting a strong response rate from Spanish-speaking clients helped identify critical gaps in VIM’s service delivery; VIM was able to use the data from its pandemic-era L4G surveys to apply for, and successfully obtain, funding for a needed medical translation service for their Spanish-speaking clients.
So What Have We Learned?
Frankly, I am itching to revisit and refresh this data to see what’s happened since April 2021. But, in the meantime, we’ve gained some important insights to my opening questions:
- Would the pandemic cause lasting shifts in organizations’ surveying methods? Our data shows that during turbulent times, organizations found old and new ways to survey clients and continue to employ these methods moving forward. Some worked and some didn’t, but organizations continued to pivot and supplement to get as much client feedback as possible.
- How much has the pandemic impacted organizations’ response rates? Even though response rates dropped, they weren’t drastically lower given the methods used and, in fact, appear to be recovering overall, suggesting this has hopefully been more of a temporary shock (at least in terms of survey behavior).
- Is obtaining feedback via surveys still useful? Organizations have been able to continue to use feedback to ultimately benefit the people they serve. In a study of L4G organizations who were most impacted by COVID restrictions, our evaluators found that half reported they made organizational changes from the feedback they collected. Anecdotally, organizations have also reported that they were able to share feedback with key stakeholders (e.g., boards, staff, funders) and secure funding to keep or launch needed programs.
Ultimately, we found that VIM’s feedback experience during the pandemic was a relatively typical one among direct service organizations. In spite of the volatile environment, survey response numbers and rates across organizations were on par with pre-pandemic times, demonstrating that the pandemic may have temporarily changed surveying methods, but did not necessarily change survey behaviors.
Footnote
The survey administration and response rate data cited in this blog comes from data that we have collected from L4G organizations since 2018. It includes response rates and details on how organizations administered their surveys (e.g., in-person vs. off-site; paper vs. email, etc.). We use this data in our response rate guidelines in the L4G program to help participants gauge whether the response rate they are getting in their feedback survey is typical or atypical compared to their peers, the context in which they work, and the way in which they gather feedback.
The Volunteers in Medicine (VIM) example was sourced from the following 2021 report: Listen4Good Through the Pandemic: 5 Learnings from Nonprofits Serving Northeastern Pennsylvanians presented by NEPA Funders Collaborative.

